Network Performance Analysis
Introduction
This report presents an analysis of network performance using two Python scripts. The primary objective is to measure various network metrics such as Round-Trip Time (RTT), hops, and throughput using ping and traceroute operations across multiple servers.
Experiment Setup
The experiments were conducted on a Unix environment, specifically on an Ubuntu 22.04.4 LTS (GNU/Linux 5.15.0-107-generic x86_64) server located in Italy. The Python scripts were designed to be versatile and can be executed on any operating system that supports Python, and that has ping and traceroute commands.
How to Run the Code
- Download the repository files from here.
- Open a terminal or command prompt.
- Navigate to the directory containing the script.
- Install all required libraries using
pip install -r requirements.txt. - Run the script using the command:
python3 tester.py. - Analyze the results using the command
python3 analyzer.pyor with other tools to load and analyze CSV files.
Methodology
Two Python scripts were employed:
- Tester Script: Executes ping and traceroute commands on a list of servers to gather raw network performance data.
- Analyzer Script: Processes the raw data, generates graphs, and calculates key metrics.
Experiment Parameters
- Servers: Eight servers across various geographical locations were selected: atl.speedtest.clouvider.net, nyc.speedtest.clouvider.net, lon.speedtest.clouvider.net, la.speedtest.clouvider.net, paris.testdebit.info, lyon.testdebit.info, aix-marseille.testdebit.info, 1.1.1.1.
- Packet Count: Each ping operation sent 4 ICMP packets.
- Payload Sizes: Packet sizes ranged from 10 to 1472 bytes in increments of 10 bytes.
Results
Estimation of the Number of Links Traversed
Using ping and traceroute, the number of hops to reach each server was estimated:
| Server | Hops (ping) | Hops (Traceroute) |
|---|---|---|
| atl.speedtest.clouvider.net | 15 | 15 |
| nyc.speedtest.clouvider.net | 19 | 19 |
| lon.speedtest.clouvider.net | 15 | 15 |
| la.speedtest.clouvider.net | 16 | 16 |
| paris.testdebit.info | 18 | 18 |
| lyon.testdebit.info | 20 | 20 |
| aix-marseille.testdebit.info | 19 | 19 |
| 1.1.1.1 | 13 | 13 |
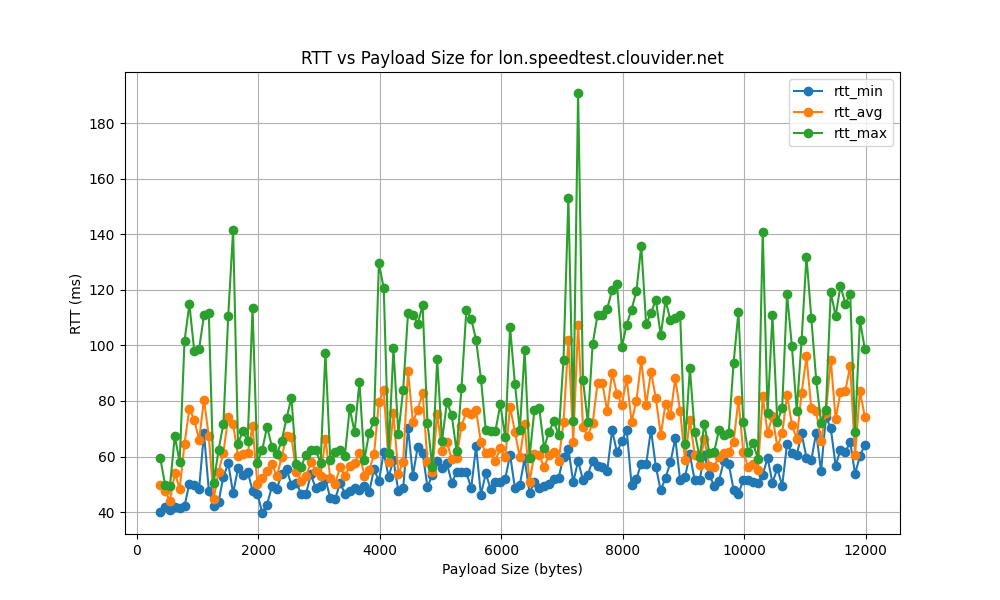
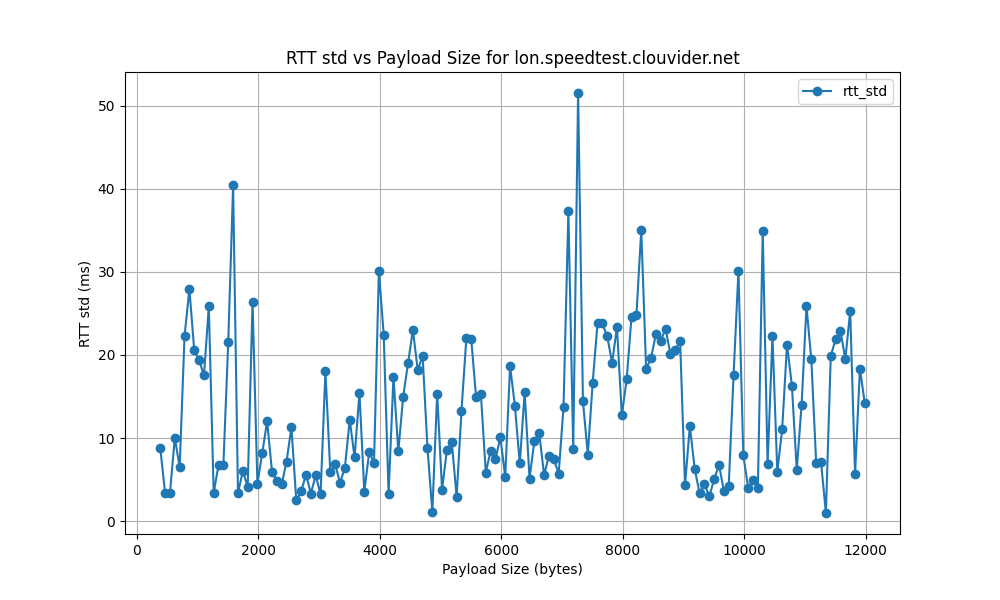
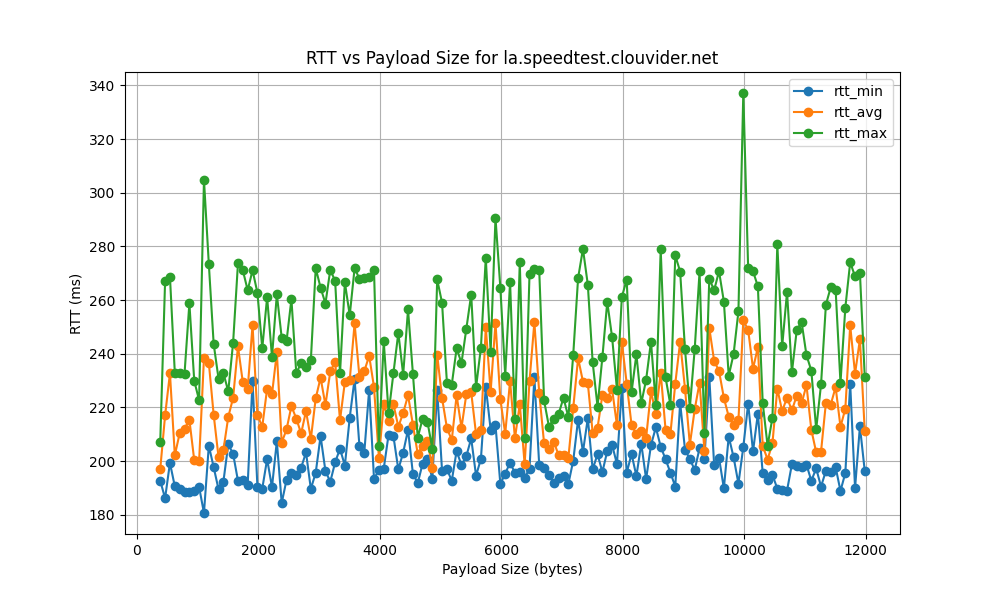
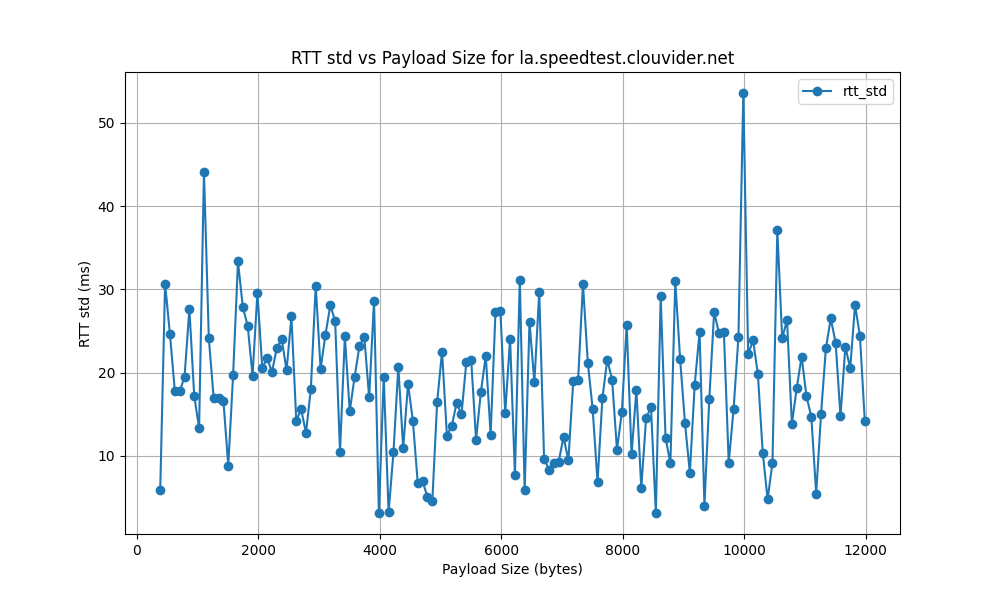
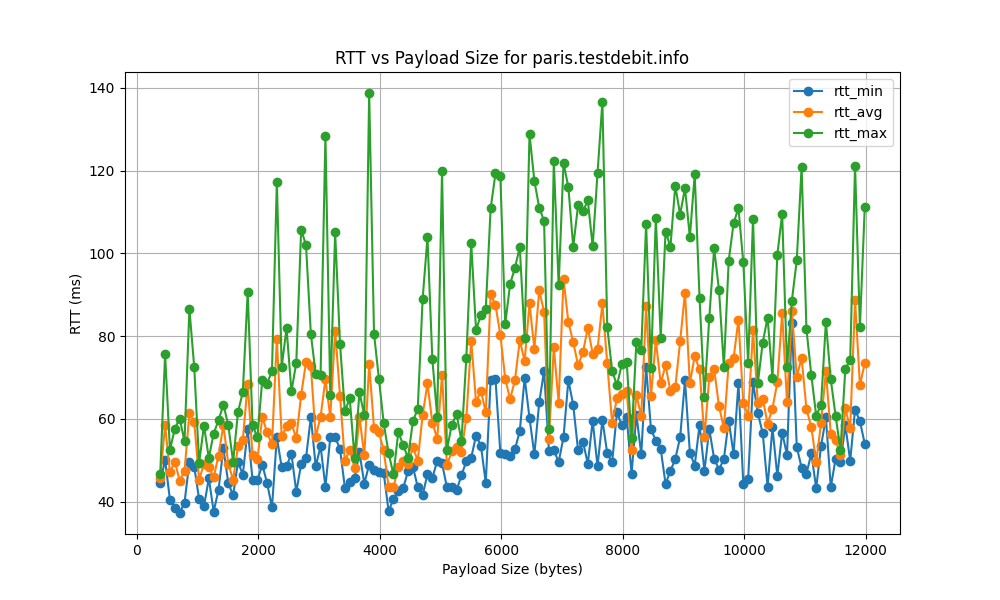
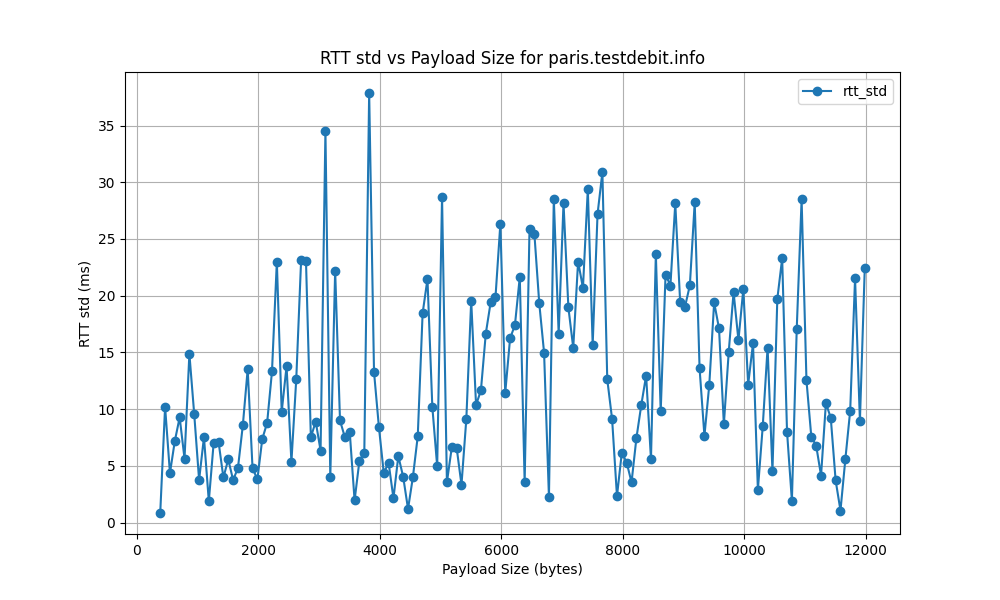
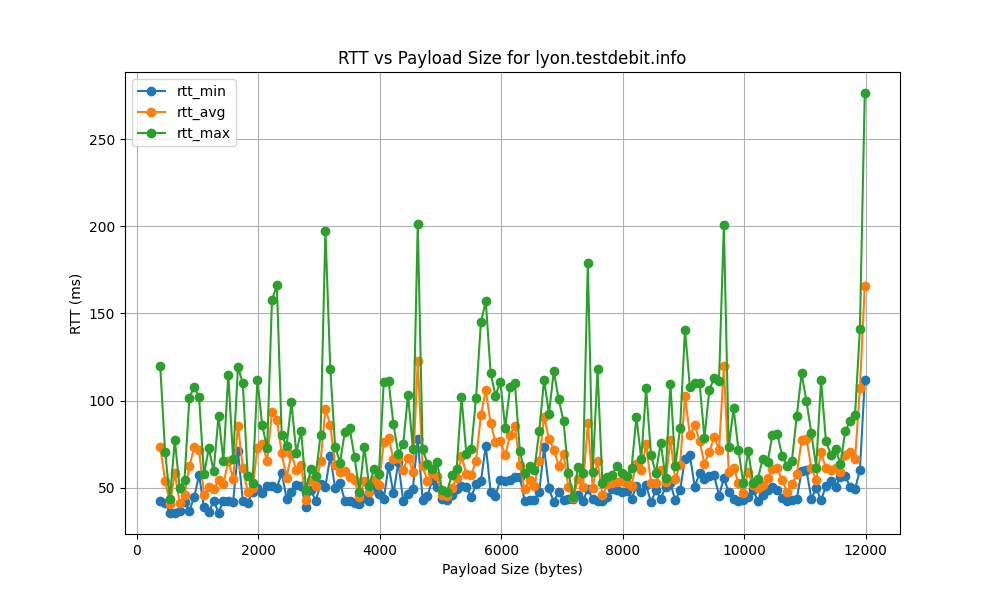
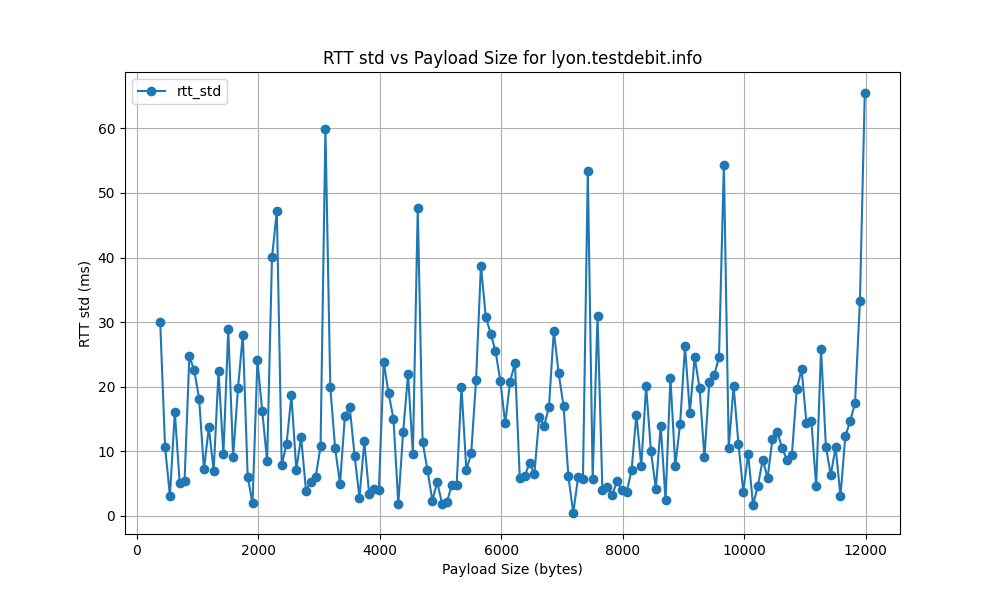
RTT Metrics Analysis
The minimum, average, maximum, and standard deviation of RTT were analyzed against the payload size to understand network performance characteristics. Key graphs are provided below for each server.
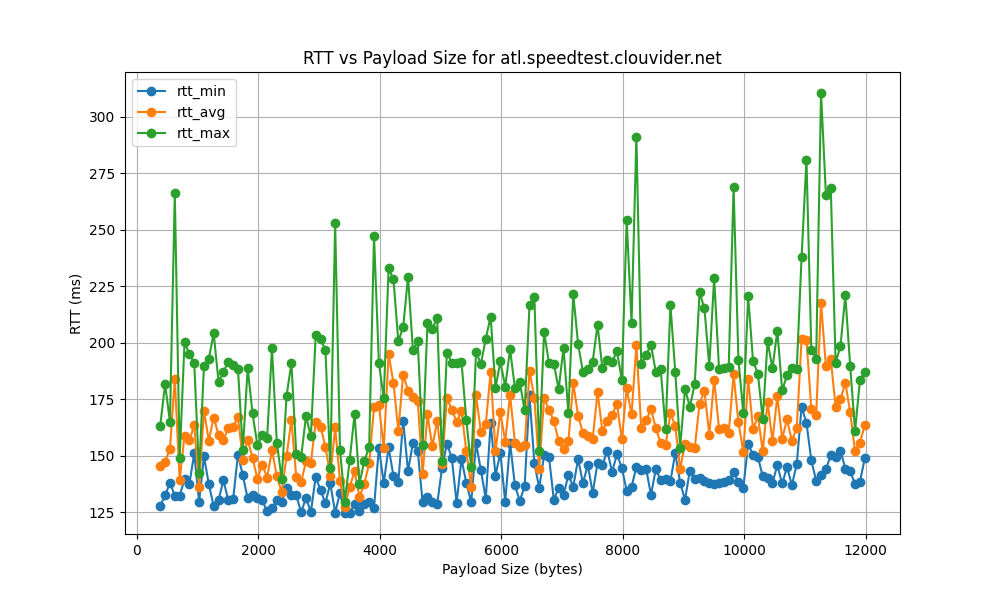
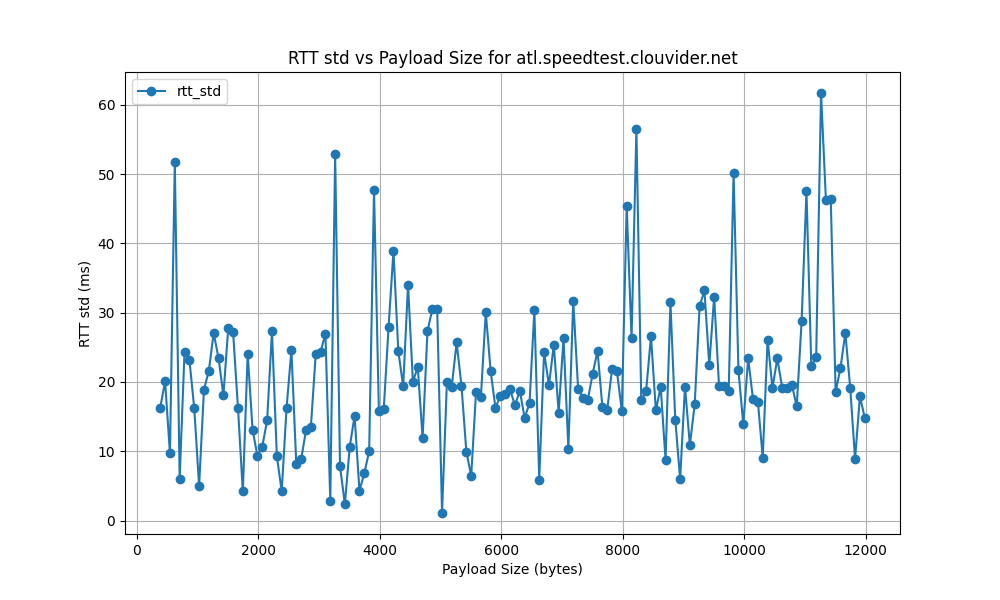
atl.speedtest.clouvider.net
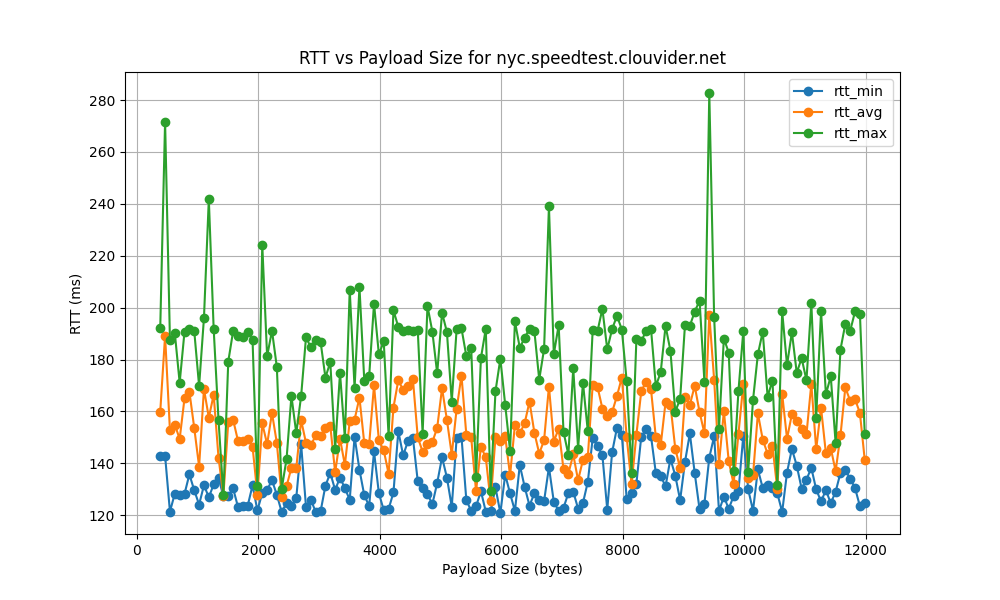
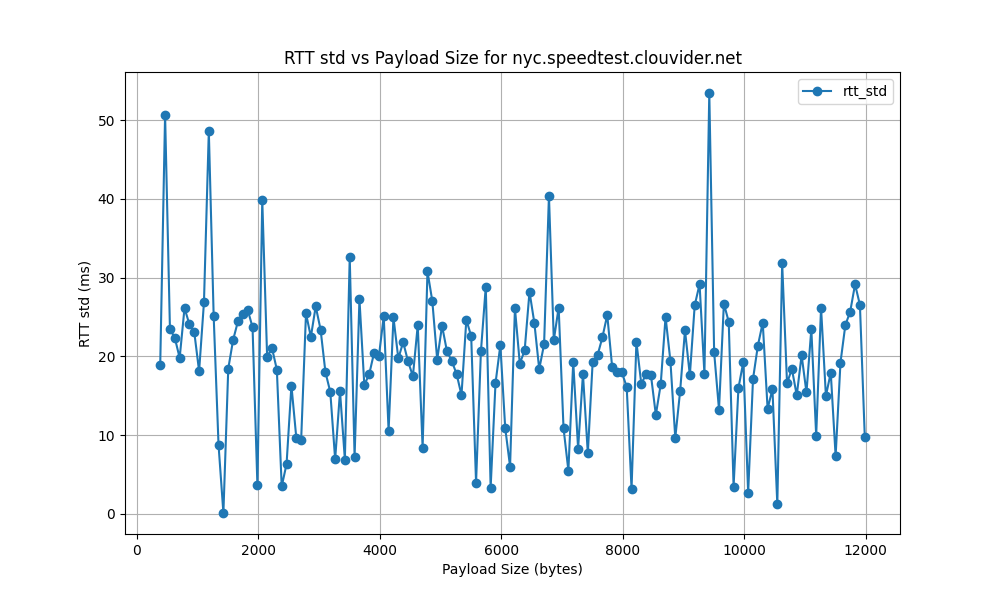
nyc.speedtest.clouvider.net
lon.speedtest.clouvider.net
la.speedtest.clouvider.net
paris.testdebit.info
lyon.testdebit.info
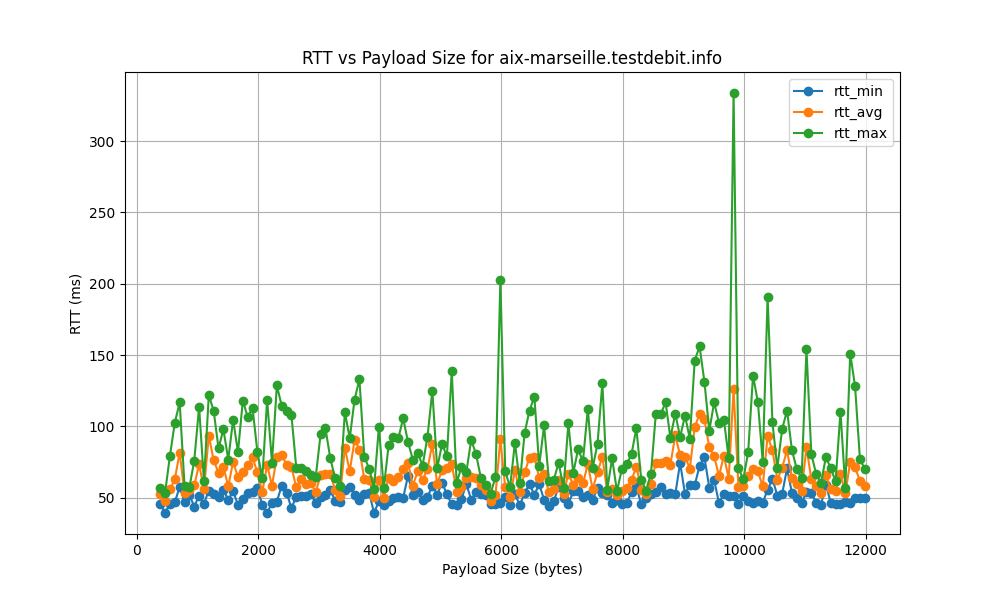
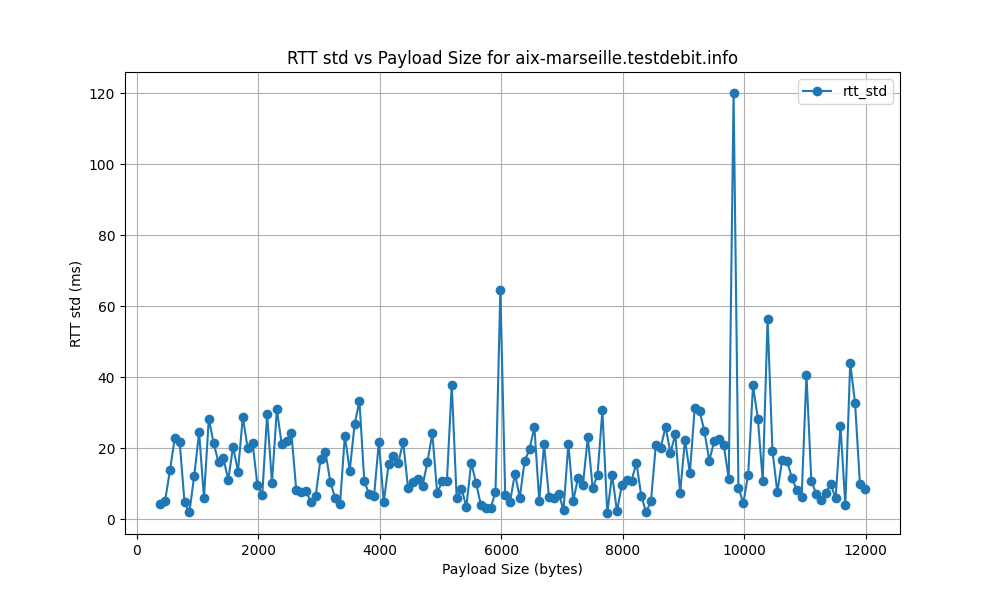
aix-marseille.testdebit.info
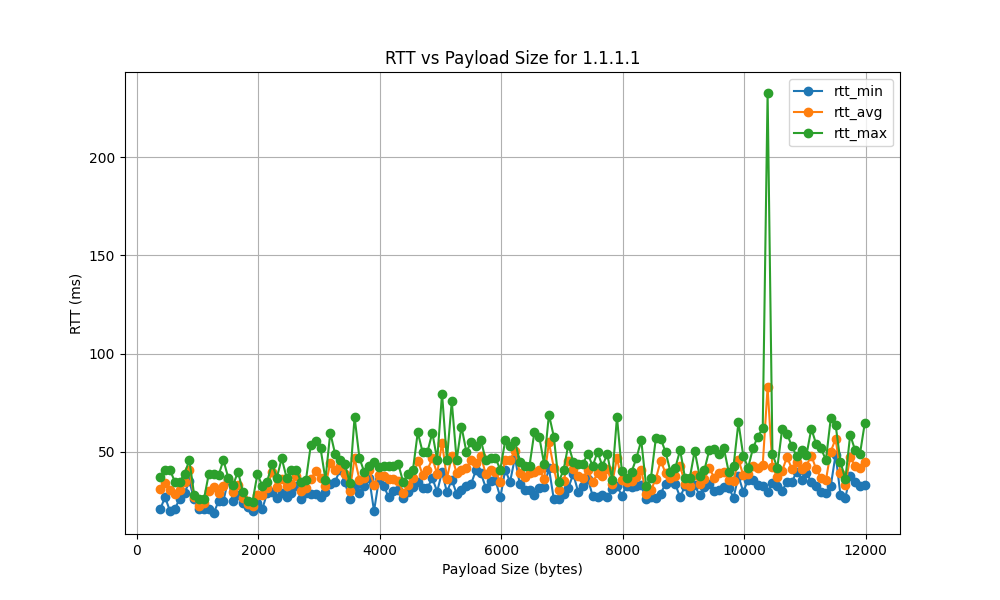
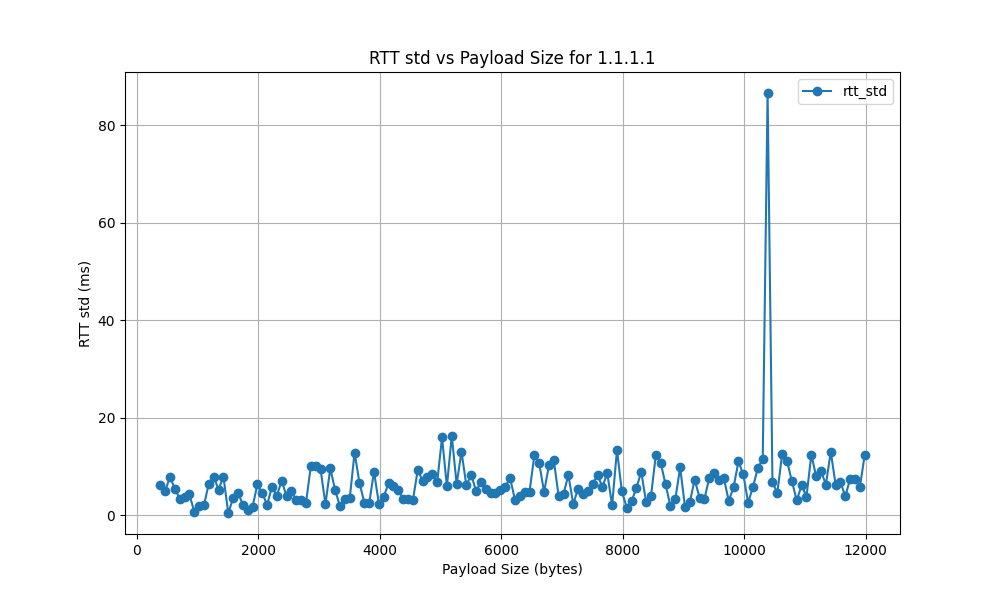
1.1.1.1
Estimation of Throughput (R) and Bottleneck Throughput (R_bottleneck)
The throughput (R) and bottleneck throughput (R_bottleneck) were estimated based on the RTT values:
| Server | a | R (bps) | R_bottleneck (bps) |
|---|---|---|---|
| atl.speedtest.clouvider.net | 0.009037 | 16156.60 | 221.32 |
| nyc.speedtest.clouvider.net | 0.002846 | 51302.68 | 702.78 |
| lon.speedtest.clouvider.net | 0.008902 | 16401.66 | 224.68 |
| la.speedtest.clouvider.net | 0.003239 | 45080.64 | 617.54 |
| paris.testdebit.info | 0.008351 | 17482.29 | 239.48 |
| lyon.testdebit.info | 0.005419 | 26944.62 | 369.10 |
| aix-marseille.testdebit.info | 0.002431 | 60053.59 | 822.65 |
| 1.1.1.1 | 0.005386 | 27107.30 | 371.33 |
Discussion of Results
- BitRate R (bps):
- Bitrate R measures the data transfer rate in bits per second (bps). Higher values indicate faster data transfer rates, which is desirable for better network performance.
- The server
aix-marseille.testdebit.infodemonstrates the highest bitrate at 60053.59 bps, suggesting excellent data transfer capabilities. In contrast,atl.speedtest.clouvider.nethas the lowest bitrate at 16156.60 bps. This discrepancy can be attributed to geographical distance, which impacts propagation delay, and differences in network infrastructure quality and capacity.
- Bottleneck Rate R_bottleneck (bps):
- The bottleneck rate R_bottleneck is the data transfer rate that the slowest link in the path can support. Higher values indicate fewer bottlenecks and more efficient data transfer.
- The
aix-marseille.testdebit.infoserver again outperforms others with the highest bottleneck rate of 822.65 bps, suggesting fewer constraints in the data path. Conversely,atl.speedtest.clouvider.nethas the lowest rate at 221.32 bps.
- High RTT Standard Deviation:
- The RTT standard deviation ranges from 5 ms to 120 ms, indicating significant variability in latency. High standard deviation points to inconsistent network performance, potentially causing unreliable connections.
- Such variability can negatively impact applications sensitive to latency, like VoIP or online gaming, by causing unpredictable high ping spikes that degrade user experience.
- New York City Server Performance:
- Despite the significant geographical distance from the testing location in Italy, the New York City server (
nyc.speedtest.clouvider.net) achieves a high bitrate of 51302.68 bps and a bottleneck rate of 702.78 bps. This performance highlights the role of robust network infrastructure and efficient routing, which can mitigate the adverse effects of physical distance on network performance.
- Despite the significant geographical distance from the testing location in Italy, the New York City server (
- Paris Server Performance:
- Despite being geographically closer, the Paris server (
paris.testdebit.info) shows a lower bitrate of 17482.29 bps and a bottleneck rate of 239.48 bps. This suggests that factors such as network congestion, suboptimal routing paths, or infrastructure limitations can significantly influence performance, sometimes outweighing the benefits of proximity.
- Despite being geographically closer, the Paris server (
Conclusion
The analysis of network performance across various servers has provided several key insights:
- Infrastructure Impact:
- The disparities in performance among the different servers highlight the crucial role of network infrastructure. High-quality infrastructure can dramatically improve data transfer rates and reduce bottlenecks, even over long distances.
- Geographical Influence:
- While geographical proximity to the server generally offers advantages such as reduced propagation delays, it is not the sole factor affecting network performance. The study shows that network infrastructure, congestion levels, and routing efficiency are equally, if not more, critical. Efficient routing and well-maintained infrastructure can offset the disadvantages of physical distance, ensuring reliable and high-speed connections.